テクニカルインジケータ
チャート作成アプリケーションには多数のテクニカルインディケータが用意されています。
インジケータを適用するには、チャートツールバーのf(x)ボタンをクリックするか、グラフの右クリックメニューからセットアップインジケータを選択します。
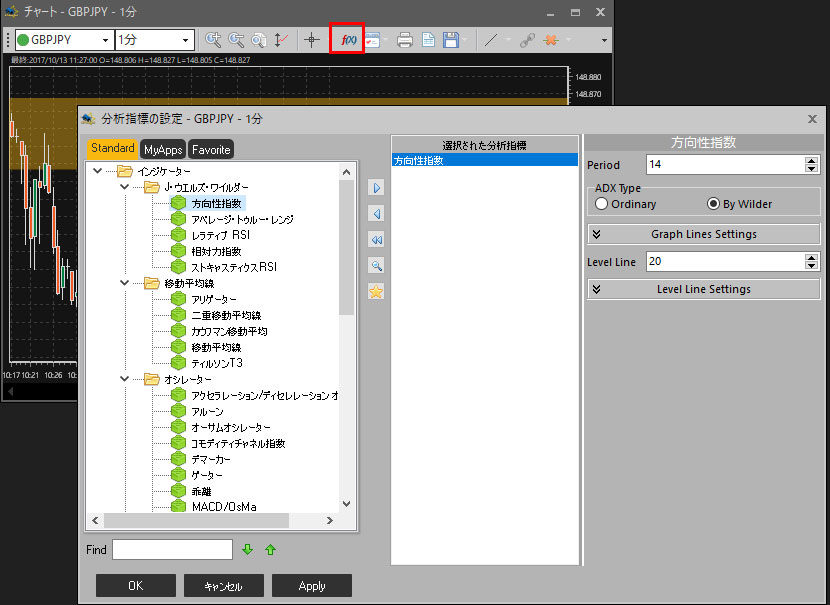
[チャートインジケータ]ウィンドウで、ウィンドウの左側のセクションの一般インジケータリストからインジケータを選択し、ダブルクリックまたは>ボタンを使用してアクティブインジケータボックスに追加することができます。 アクティブなインジケータがグラフに表示されます。 ウィンドウの右側のセクションでは、個々のインジケータを設定できます。
インジケータは、ウィンドウの下部にある検索ボックスに名前(またはその一部)を入力することで検索できます。
システムインジケータは、次のセクションに分かれています。
•J.ウェルズ・ワイルダー
– Average Directional Movement
– Average True Range
– Parabolic SAR
– Relative Strength Index
– Stochastic RSI
•移動平均
– Alligator
– Dual Moving Averages
– Perry Kaufman’s Adaptive MA
– Moving Average
– T3 Tilson
•オシレータ
– Accelerator Decelerator
– Aroon
– Awesome Oscillator
– Commodity Channel Index
– DeMarker
– Gator
– Kairi
– Moving Average Convergence/Divergence
– Momentum
– RAVI
– Rate of Change
– Standard Deviation
– Stochastic
– TRIX
– Williams’ Percent Range
•パターン
•トレンド
– Auto Trendlines
– Bollinger Bands
– Chandelier Stop
– Envelopes
– Flipit
– Hi Lo Activator
– Ichimoku Kinko Hyo
– Keltner Channel
– Linear Regression
– Pivot Points
– Price Channel
– Weighted Close
•ボリューム
– Accumulation/Distribution
– Market Facilitation Index
– Force Index
– Money Flow Index
– On Balance Volume
– Volume
•その他
– Fractals
– Gann Swing Chartist